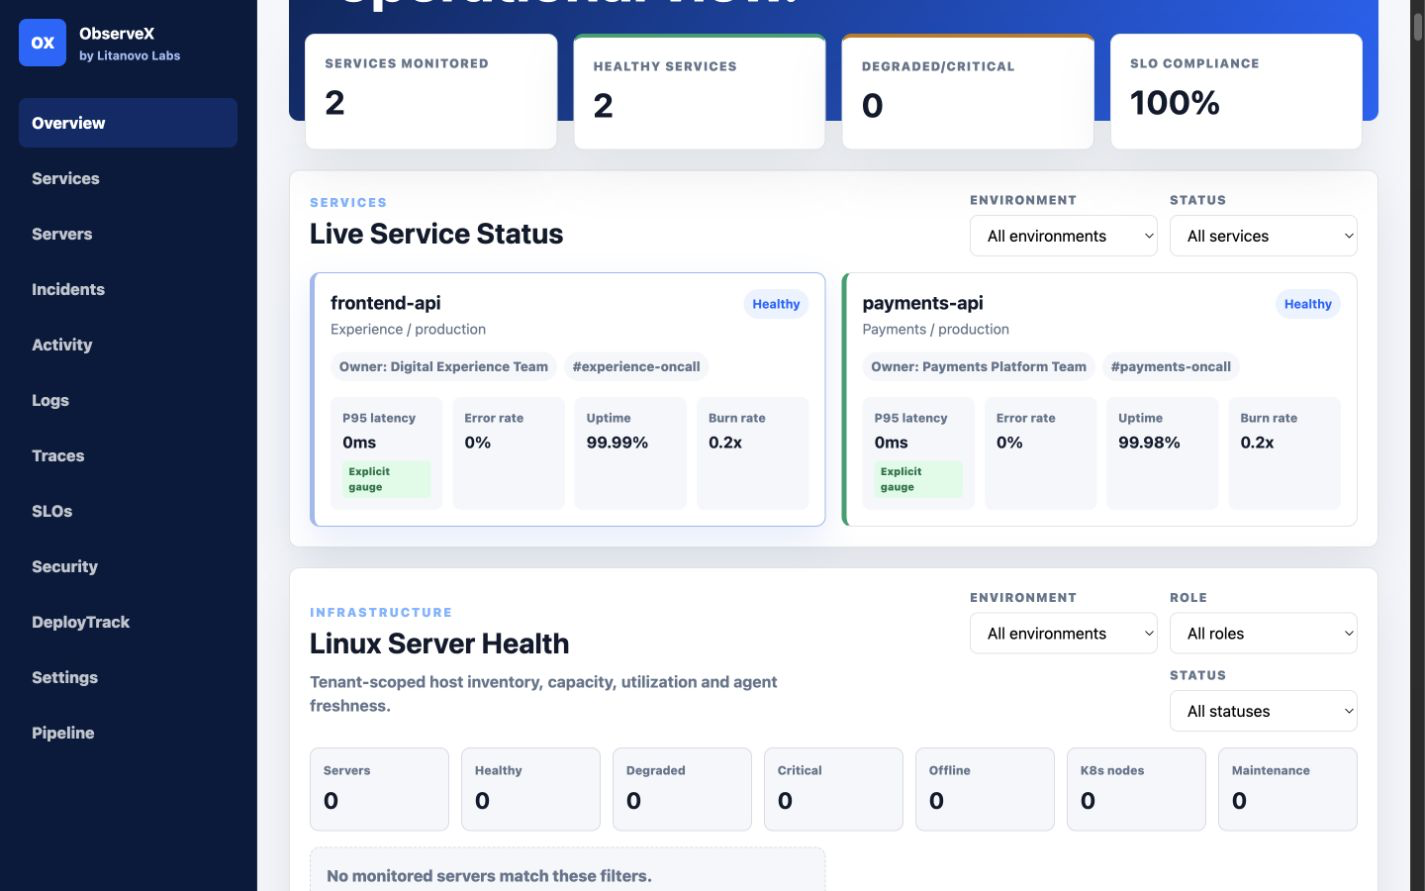
Service health
Latency, error rate, uptime, burn rate, ownership and environment health in one place.
Litanovo observability initiative
ObserveX brings service health, metrics, logs, traces, incidents, SLOs, security posture and DeployTrack release evidence into one cloud-native operational view.
Product capabilities
ObserveX is in active development. The current product focuses on practical visibility across cloud-native services and delivery workflows.
Latency, error rate, uptime, burn rate, ownership and environment health in one place.
OpenTelemetry-aligned navigation across Prometheus metrics, Loki logs and Tempo traces.
Acknowledge, resolve and audit response actions with clear operator context.
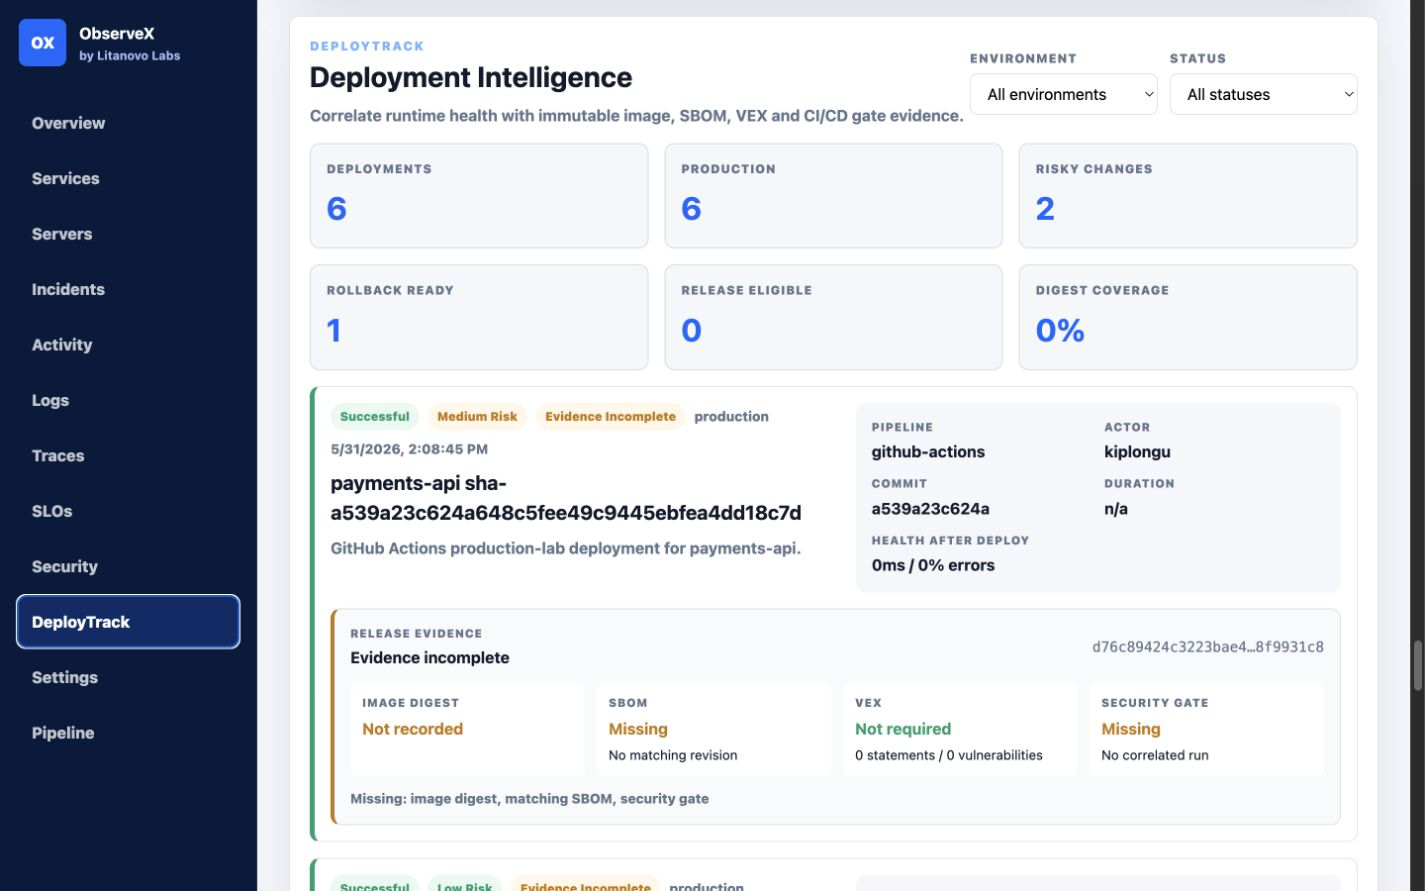
Connect releases, commits, ownership, rollout status, risk and rollback readiness.
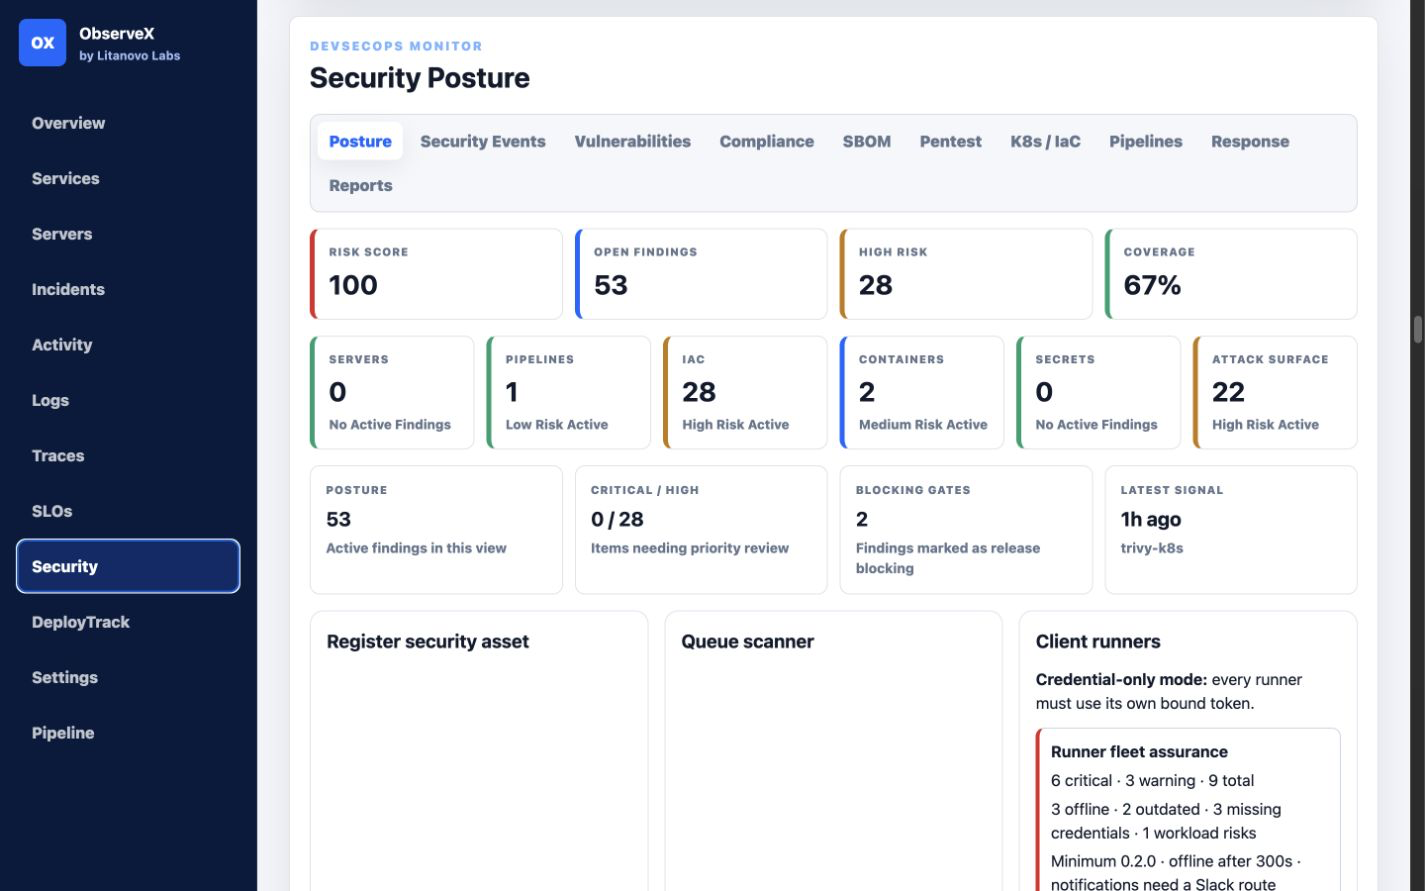
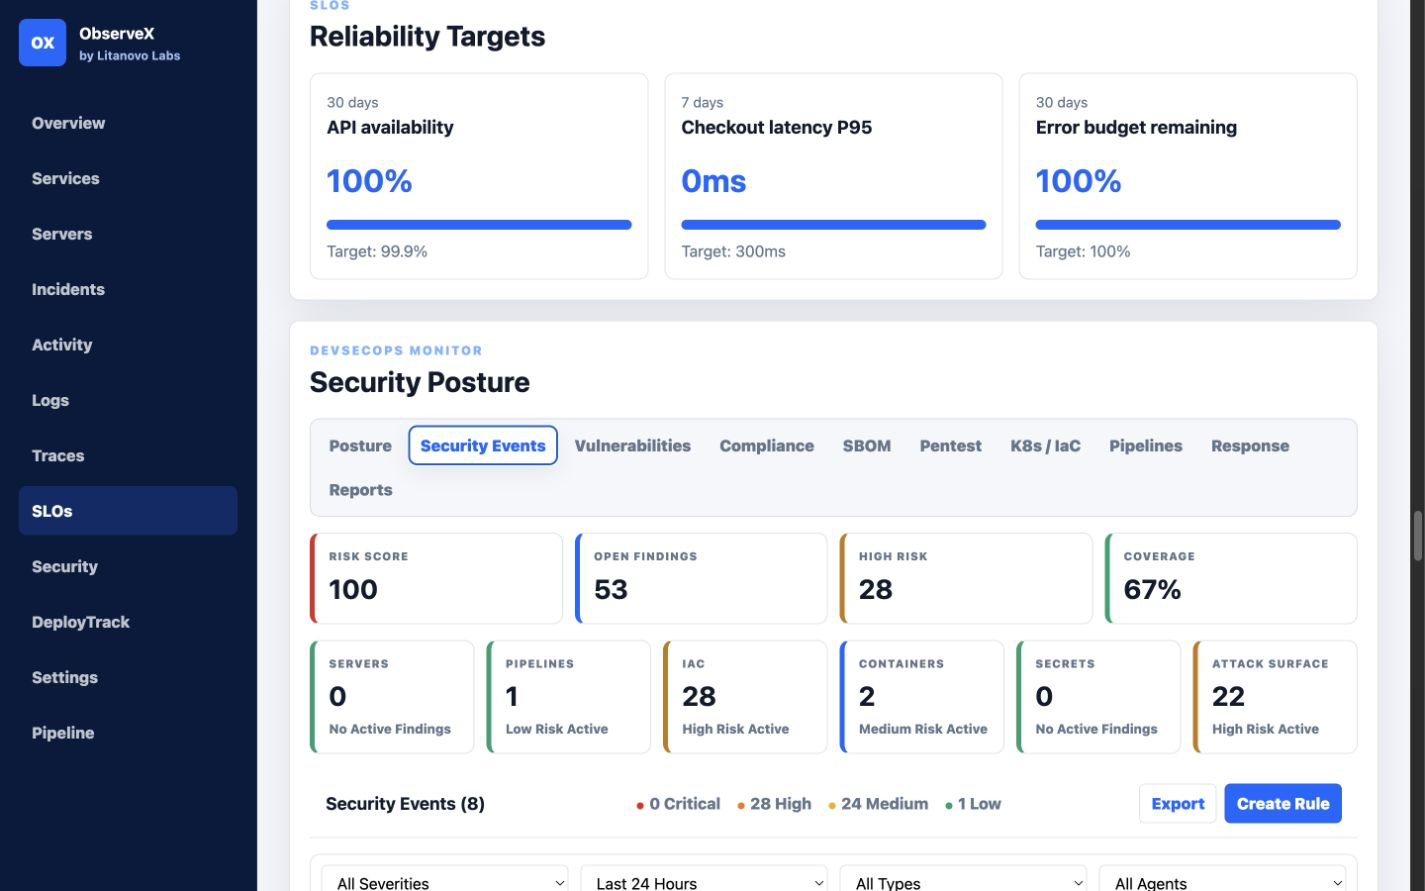
Bring findings, coverage and remediation workflow into the wider operational view.
Keycloak, RBAC and PostgreSQL row-level security concepts for tenant isolation.
Product preview
Latest screens from a controlled demonstration environment using representative service, security and deployment data.
Request a guided walkthrough using the controlled demo environment.